* Due to confidentiality, the names of the organizations and what the data was representing are not revealed.
*This content has been modified to accommodate new content for Intersect tool and better clarity for the procedure of Spatial Join
Recently, one of my senior colleague requested my GIS expertise to produce new insights on mutiple Excel spreadsheets. Basically, I was provided with:
- MapInfo tab (which was converted to shapefile subsequently) file of a linear route (polyline). It had two rows of data - File A
- MapInfo tab file of a polygon of the route with the segments (90+ rows) - File B
- Excel spreadsheets over the years of condition data based on hundreds of points.
My first assignment with the project was to identify the need of adding a new asset or not on 90+ segments of this linear route. This was done through visual assessment of Street View. Since I am predominatly trained in the ESRI world, all the spatial data was converted into shapefile using QGIS Translating tools ('Save as' the MapInfo Tab as shapefile)
Intersect
Problem
The second part of the project was to calculate the distance of each segment of the polygon route (File B). It is clear that the automatic way of calculating distance for a polygon is not possible. Calculate Geometry tool only calculates perimeter or area of the the segment. However, we have File A where it is a polyline (where Calculate Geometry is able to compute distances).
 |
| File A (polyline) highlighted in blue and File B (polygon) lying below the polyline. |
Solution
- For this case, File A has two rows. I remove the shorter row as I need to calculate the maximum distance of each segment. Choose Edit mode and highlight the segment to be delete. Press the Delete ('X' sign)
- Ensure the polygon file (File B) has valid geometry. If the polygon has 94 rows, each segment must be touching at each other and not overlapping or having gaps. For a successful Intersect to occur, geometry must be validated and errors must be rectified. I opted to use QGIS for geometry validation as it has easier to understand validation tool (Topology checker)
- We have reached the most important part, how can I bring the 94 segments of polygon (File B) across to the single row of poyline (File A). We have two options here to consider : Union and Intersect. An output of union would create a polyline file of the File A and the perimeter of File B (see below)
Union of File A (polyline) and File B (polygon) - Clearly from the above image, the Union does not produce the desired results. Let's look at the option called Intersect.
- Under Geoprocessing, choose Intersect and populate the dialog box as shown below. Input the two features (File A and File B) in the dialog box
Intersect Tool - Choose the output as line and let's bring all the attributes of the polygon to the polyline. Output as below.
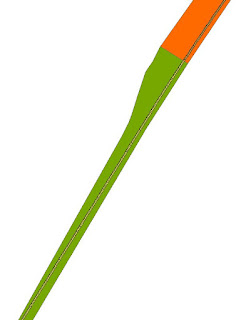
Intersect output - To verify the Intersect went well, do two checks on the dataset. Firstly, is the number of rows of the new polyline (File C) the same as the number of rows in polygon? This can be done viewing through the Attribute Table of the new polyline. Secondly, do a visual check. Overlay the new polyline with polygon of File B.Does it visually match? Refer to image below:
Visual check. Is there any suspicions on the green line? Use the Information Tool to check the IDs
Spatial Join
Problem
However, the important part of this short blog post is about the third part. My consultant has an Excel spreadsheet of hundreds of points carrying condition and X and Y coordinates. He wants to know the relationship between points and File B (polygon segment). In short, he wants an updated Excel spreadsheet showing the condition points and the road segment it is attached to.
There are two ways to do this : manual visual check or a Spatial Join
There are two ways to do this : manual visual check or a Spatial Join
Solution
Part A
- Each Excel spreadsheet had approximately hundreds of coordinate points with the condition data. To display them, the file was saved as a .csv file and brought into ArcMap.
- Subsequently, I chose display XY data (ignore the part you need to convert into layer) to visualize the hundreds of points on ArcMap. Please nominate the correct projection.
- To proceed to the next stage, the csv output has been converted to point based shapefile.
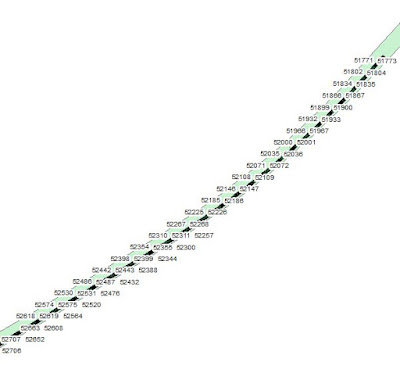
- Overlaying the condition data (point based) and File B (polygon file), you will see the results as below:
 |
| Demonstration of hundreds of points being overlayed over polygon. |
Here is a situation where spatially, the Excel output and File B are located on the same place but from an attribute perspective, they have no relationship. My consultant wants to see the relationship of segments of File B and points. As mentioned before, there are two ways : Manual or Spatial Join.
The manual process is guessing the locations of points using ArcMap and populating them according to Excel. This is very tedious process. I am pretty sure that I wasn't consulted for tedious method, but for a GIS automatic process.
I contacted ESRI for assistance as I want to avoid the manual method. They recommended the Spatial Join.
- Overlay the condition point data over File B.
- Please ensure the polygons of File B do not overlap or have invalid geometry.
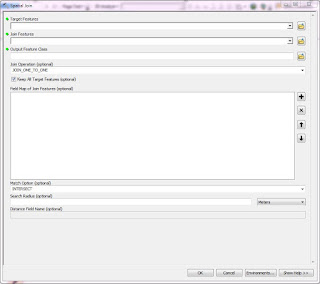
- Go to ArcToolbox > Overlay>Spatial Join.
- In the dialog box, please pay attention to important details as shown below.
Spatial Join Tool 1) Identify who is the Target feature - this is where the information (from adjoining file) will be carried across.2) Match Option - Since the join is done purely on spatial location basis, we do need to clarify the join is based on a particular premise. For this instance, points must wholly enclosed by segment - Completely Within. - In this case, we want to know the segment ID for each point. The Target Feature will be the points and the Join Feature is file B. Though optional for Field Map section, it is important to nominate the fields to be carried across to the output. The segment ID should be carried over.
- Press Ok and the output (File D) comes out.
- Overlay File D over File B. Perform a visual check. Change the symbology of File D and File B to reflect the distinctions of Segment ID. Refer to Image below.
Spatial Join Output - Does the output make sense? Do check the points at the boundaries of the polygon segment.
Essentially, I was attaching the segment ID with thousands of points. As my consultant wants two Excel Outputs per year, this Spatial Join did a wonderful job in delivering desired result.
Once the new shapefile is produced, I pushed out the attribute information into Excel. Subsequently, I replicated the same procedures for all other Excel spreadsheet. I do recommend that everyone who opt this method should verify the results after the join is performed.
Below here is a video on how to do Spatial Join:
If you want to seek further clarification, please drop me a message below here or at the contact me page.


