Pages

Total Pageviews

Sunday, 25 May 2014

Mapping? What is that?

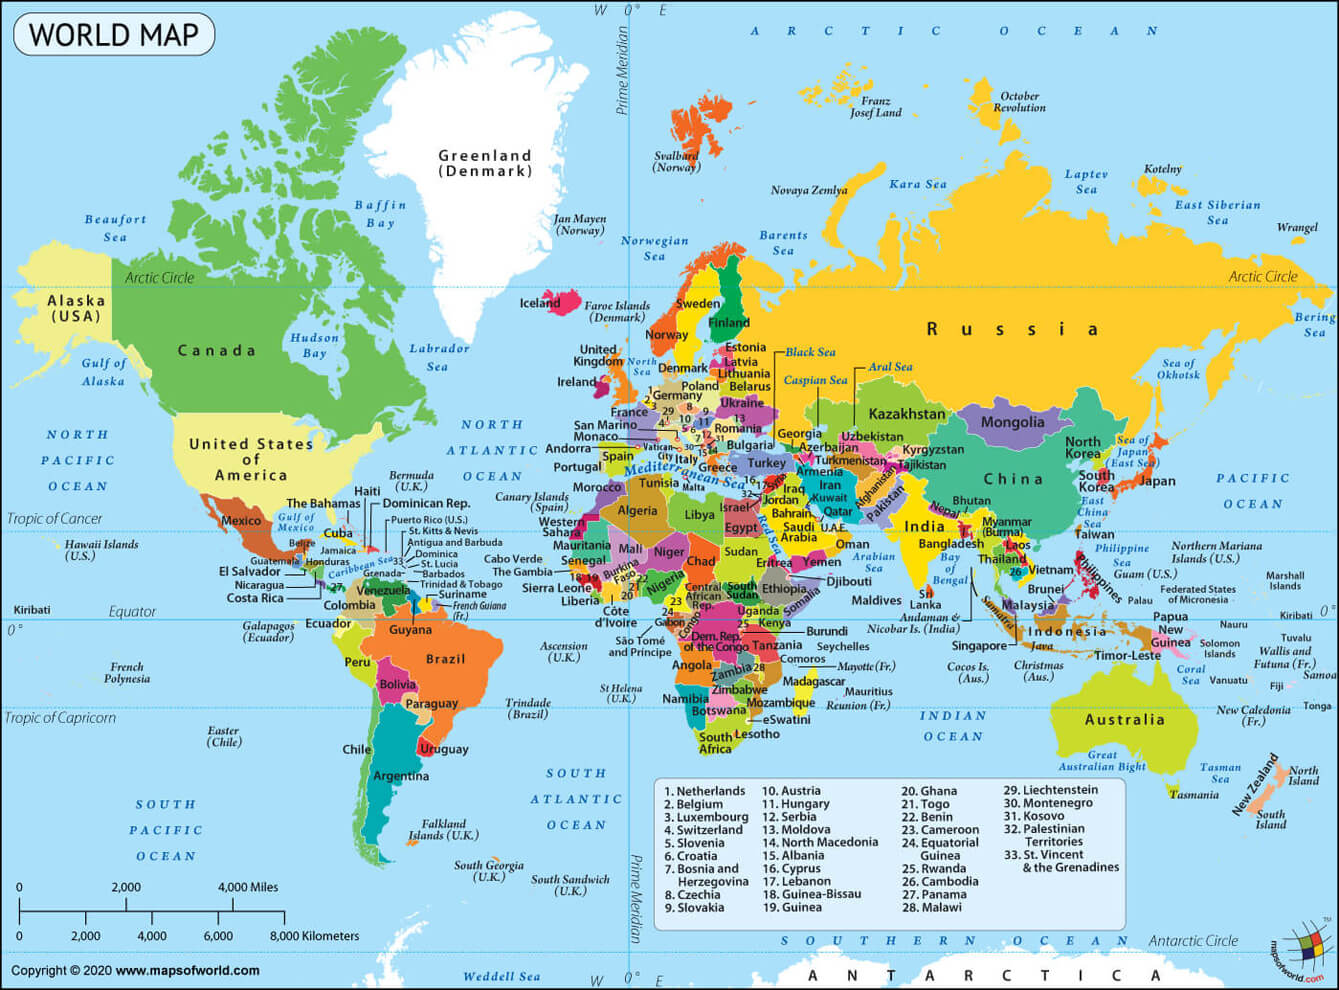
Courtesy of Maps of the World.com

A common question I receive: "What do you do" or back in my university days, "What do you study?"
When I reply "Mapping", question mark appears in everyone's head. "What's that?" My standard response to these questions is Google Maps, GPS etc. However, is mapping all about that? Today, I will discuss a general idea of mapping, the profession and why it is so important nowadays to know this field.

Mapping, first of all, is a generic term I use for people to understand. The official term the map-makers use are Spatial Science, Geospatial Science, Cartography, Surveying, Remote Sensing, Geoinformatics etc. In an essence, mapping is all about representing and modelling the Earth. It could be in 2D (flat maps), 3D (Google Earth) or 4D (with time lapse). In order to receive the final product (the map), all of us must know and appreciate 3 steps involved in a map production:
  1. Collection of map (spatial) data. It could be done through field surveys, satellite images, computer databases, high quality photos from aeroplanes or other sources.
  2. Analysis of spatial data. This includes making sure the coordinate system is correct, 3D modelling, applying geographical analysis (e.g. what is the closest shop to my place)
  3. Presenting of spatial data. This process where cartography (marriage of art and science) truly comes into light. The maps must be meet its own purpose (e.g. environmental map), reader friendly and ensures the user focus on the map message (purpose)
One may perceive all the time maps 100% but they are never correct. The changing world, errors in data collection or in analysis and mistakes in cartography all dither the accuracy of maps. We, the map-makers, must make sure the maps serve its purpose to user and that influence level of accuracy we display on maps.

How do you call a map-maker in the right term? There are heaps of official terms: Spatial Scientist, GIS Technician, Cartographer, Surveyor, Image Analyst etc. We are an unique clique and throughout history, our percentage of the workforce population is more or less the same (very small). We make so much impact in our daily lives yet we are unknown to the world since dawn of humanity. The most we could relate to environmental scientists, geographers, architects, IT groups and civil engineers.

However, the world is changing as technology is pushing the mapping concepts beyond our professional scopes. This leads to my final point - why it is important for you to know us and our concepts:
  1. If you are in government, the government of any day dictates what is placed in the maps, standards and licences of them. At the same time, using advanced geographical analysis, maps power government in service delivery in good and bad times. If you watch disaster movies, you can see how emergency departments pull up maps or display 3D models on the fly to make decisions
  2. If you are in business, location intelligence is so critical nowadays to understand your customers. You make the decision (based on maps) where to put next fertiliser for your winery, to determine a new store location, to close down a bank branch and many more decisions. Businesses working with government clients develop new technologies with mapping applications to help service delivery
  3. If you are in NGO or a citizen, knowing how to use mapping tools is absolutely useful keeping checks and balances on governments and businesses. Maps could be used to track the movements of endangered species, the impact of new highway on properties around, to check on gerrymandering or mapping out corruption abuses.
While maps has its own controversies, I personally believe everyone should learn how to use some map tools (beyond Google Maps or GPS) so that you will truly understand on how we relate to each other and the natural world. That is the final objective and purpose of the map: Understanding the relationship between entities that make up the world and how each affect another.

Happy Mapping!

Saturday, 10 May 2014

Are you tweeting with me?

Source: Therainmarkerblog


Quietly, I have launched my official twitter page of this blog. You might be wondering the silence of this blog or lack of new, researched articles. I have been busy and writing articles do take a lot of time.

I want you -readers, subscribers and viewers - to subscribe to @daneshatlas . It is official twitter page of the blog-presenting article, videos or anything about geospatial matters. Let me handle the research for you on this area and you will LEARN HEAPS! 

How can I find twitter link? It is on the right hand side on the navigation pane and it will take you to twitter page

Start FOLLOWING, LEARN and ASK me what should I POST!

Sunday, 20 April 2014

Story of Mauritius

Final Product: Terrain of the Site
Few days ago, a friend of mine called me, "Danesh, can I get a map of my area - middle of Mauritius?" I said yes without asking much detail. Then, he messaged me, could you focus on Plaines Wilhems (state in Mauritius). With this little detail, I hastily pulled out the datasets required for Mauritius. After all, the concept of producing the map is the same but when it comes datasets, it becomes trickier.

For the terrain data, I relied upon ASTER GDEM. When it came to the roads, boundaries, rivers and lakes, I pulled out from DIVA GIS. You would notice how generalized these datasets (DIVA GIS) look in comparison to the terrain data. This map you see above is 1:100 000 and DIVA GIS datasets weren't exactly the best for the scale context.

One of the challenges I faced was capturing the terrain feeling of this area. This area (Plaines Wilhems) is rising plain area with steep cliffs marking its borders in the west. After much experimenting with the colours, I utilized 10 colour classes to give smooth transition of the terrain (hillshading was pixelated at 1:100 000 scale).

Within 3 hours, the map was completed (with all necessary items added) and emailed to my friend.  He was happy and then he asked me, "Can you do a 3D Model?" From my previous experience, I said yes and thinking in 2 days, a  3D Model would fit his requirement. Turned out, there was problems indeed.

Lessons Learnt:

  1. Do you charge a friend? I am no longer a student and now, I am professional. I am entitled to charge you. That's what you think. Of course, there is nothing wrong except you need to know the restrictions found for the datasets. ASTER GDEM strictly made it clear, you cannot commercialize their datasets. From my understanding, I CANNOT CHARGE a single cent on my friend despite spending 3 hours to make a map. DIVA GIS datasets do not seem to have these restrictions. Can anyone clarify what you mean commercialize in geospatial data context?
  2. Learn to get full details. I am happy to hear that my friend actually researched on when sourcing the terrain data. When he struggled, then he came to me. I should have asked him bit more details of the map project (Does he want 2D or 3D?). In heat of my excitement, I overlooked these information
  3. I do not why ArcScene could not read the elevation heights of the terrain datasets. After all, it has an attribute called value (which is elevation cell). I explored what ArcGIS, QGIS and Google Earth could do representing the 3D Model of the site location. However, I told my friend something is wrong with terrain data and I can't help him on that. Fortunately, he saw the site location was largely flat and the 3D Model would be unnecessary
In short, I was excited to this project but there are couple of lessons learnt when it comes to produce maps for people. I just need someone explain to me why terrain data is not being displayed in 3D format in ArcScene!!

Friday, 14 March 2014

Hiatus in the Blog


Courtesy: http://zenrevolution.files.wordpress.com/2012/07/silence.jpg

Wondering why the silence in my Blog? Yes, I would be taking break at the moment in updating the blog. I have lined two part series articles on Naming issues. So, what I have been up to

Venezuela Atlas Project

Draft of my Venezuelan A1 Size Map
If you scroll in the blog archive, I did mention about my big Venezuelan Map Project (http://daneshatlas.blogspot.com.au/2013/08/creating-a1-size-map-of-venezuela.html). I was assembling the datasets and started working on cleaning and updating them from June to October. Then, I suspended the project for three months for another project (mentioned below). On 1st February 2014, I officially resumed the project. The whole of February was devoted to complete the first round of dataset cleansing of every state in Venezuela (primarily road checking). On 1st March, the BIG MOMENT came! For the first time in my life, I am print out A1 size map (I was imagining the size while going to the print shop). With the draft map, I have begun the scrutiny of the map and scouting every possible error. This month would be devoted to add the cities and their population data across Venezuela. For other months, I haven't planned out the project scope. I hoping to conclude the project tentatively on 30th June 2014. Time is short

Tindak Malaysia Delimitation Project

My proposed Kedah map demonstrated in the Tindak Malaysia Forum
Part of the reason Venezuelan Atlas project was suspended is because I was involved in the Delimitation Project. Refer to http://daneshatlas.blogspot.com.au/2013/09/mapping-and-elections-part-2.html for details. I was involved in the project from July 2013 to February 2014 (where the forum is the culmination of Tindak Malaysia's Delimitation project). This NGO based in Malaysia created a network of volunteers of map-makers (hardly anyone came from cartography/geospatial background). After experimenting different softwares, we made a shift to non-GIS based softwares to speed-up the completion of national election mapping project. This project aims to redistrict the mal-apportioned electoral boundaries in Malaysia fairly. As the pressure grew to finish the project, me, being the lone GIS user was rushing through (in the wee hours of the morning) to complete Kedah map (the state I was allocated with). Two proposed maps were produced, matched the publication specifications and finally submitted in early February. Forum was held on 15-16th February, since then our maps (including mine) would have been viewed or questioned by many people at the forum or outside.

The purpose of these maps is to challenge potential Malaysian Election Commission (EC) Maps. It was rumoured that EC will start the drawing in March (no further updates since then). Meantime, this NGO and other election related in NGOs in Malaysia have been engaging the public to get involved in electoral redelineation project. Tindak Malaysia's approach conducted without on ground voter consultation. However, if EC were to do their maps soon, this NGO's maps could be used by the public to object them.

I am still involved with them and still advising them on GIS matters.

Basically, these two projects made my blog very quiet. So don't panic about the blog being abandoned. I hope I can release new articles towards the end of the month.

Saturday, 8 February 2014

Visualizing Data

In one of my recent projects (back in January), I was working on converting text data of Wifi locations in Penang (Malaysia) to an online map of internet hot spots. Basically, I was visualizing boring wordy and lengthy data to graphically pleasing locator tool.

Refer to: Penang Free Wifi Project
Presentation from Geoplex

Thursday ago, through a friend of mine, I came to know an open event in Melbourne about Visualizing Data. It was hosted by GIS consulting & solutions firm, Geoplex and around 30-40 people (I think) attended for this exciting event. We had four speakers: Geoplex, City of Melbourne, The Age (newspaper) and Flink Labs. The first presentation was visualizing traffic accident data using CartoDB. Geoplex built an interactive web map whereby user can estimate the risk of accident on a specific route (they are travelling on). However, I couldn't understand the workflow from sourcing the information to the final product.

Melbourne Urban Forest Visual

 The second presenter came from City of Melbourne and he was talking about CityLab projects. Basically, CityLab is a physical and virtual space for the council and the community to engage to resolve urban problems. At the same time, there is push in City of Melbourne on the concept of open data (free datasets for public to download and use). While open data enhances transparency and accountability, there is a lot of challenges. For example, datasets relating to utilities comes from energy & telcos companies while dataset of tree & parking location come from the council. However, both datasets cover the same area (i.e. Melbourne). The push of open data would be obstructed as different policies govern about datasets in different institutions (e.g. telcos, council). Second challenge of open data is what and how much to share the datasets. Should we make all the datasets for public view or how much of utilities information can be downloaded free? Anyway, City of Melbourne has collaborative project with its concerned citizens on air quality (Citizen Science in action). For example, citizen scientists armed with air sensor networks feeds on air quality information to city of Melbourne. Yes, the city of Melbourne has its own network of air sensors but with citizen scientists, a lot of gaps in data are filled up. Whether it is related to CityLab or not, City of Melbourne developed online map showing all the trees in the council. Called as Melbourne Urban Forest Visual, users can click any of the trees and get basic information. For the council, it is great planning tool as they can identify which trees need to be removed (if they are dying soon). For users, interestingly, you can email to the tree and state your feelings towards each tree.

Map of Car Thefts incidents per council in greater Melbourne (The Age)
Third presentation was about data journalism and the speaker came from The Age (leading papers in Melbourne). Data journalism essentially is getting the story from datasets and nowadays, data literacy is critical for journalists to back up their stories with evidence. Data Visualization of particular topic (i.e. feelings of people of the day) opens more stories and exploring micro trends in local community. For example, The Age (with collaboration with Trend Maps) created a map of Twitter feelings in greater Melbourne. Interestingly,visualization presented concentration of positive feelings in shopping centres and negative feelings along train lines & stations. Similarly, in 2013, with collaboration with volunteers, The Age created a map of locations of high-risk cycling accidents in Melbourne.

Flink Labs project of visualizing trolley movements in shopping centres

Final presentation came from FlinkLabs. This company focuses heavily on data visualizations. Some of their interesting projects they did were visualizing movement of shopping trolleys in shopping centres (trolleys equipped with RFIDs) and dynamic cartograms of shifting world trademark applications from Japan to China. In the case of trolley movement, this visualization helps store managers to know which aisle is most frequented of and deduce some reasoning of the frequency (likewise for less frequented sections too). Visualization is growing rapidly as it creates 'techie' feel in every project done. However, the problem today a lot of visualization is data poor and lack of substance. This becomes more true with 3D printing as this visualization is not so much of data analytics tool, but for more artistic purposes. The speaker stated (following on what The Age journalist speaking on) data visualization is not the end product and it is tool for pattern analysis and stimulating ideas.

In short, Data visualization is converting long,wordy and boring Excel (and other data formats) into visual pleasing graphics to stimulate our thinking process. Expect more and more of data visualization in the years to come as tools of data visualization is being integrated more and more with our simple tools (i.e. Excel)

Thursday, 16 January 2014

BIG THANK YOU!


On the first anniversary of start of my blog (16/1/2013), I want to issue a BIG THANK YOU!

  • BIG THANK YOU to my COURSE MATE who asked me to start the BLOG!
  • BIG THANK YOU to all of my SUBSCRIBERS!
  • BIG THANK YOU to one who RECOMMENDED me Google Analytics!
  • BIG THANK YOU to all of my friends and contacts COMMENTED on my maps and articles!
  • BIG THANK YOU to EVERYONE who PARTICIPATED in the SURVEY!
  • BIG THANK YOU to THOSE who have CRITICIZED and QUESTIONED the relevance of my blog and maps!
  • BIG THANK YOU to EVERYONE who visited my blog for past one year!
Anyway, do not think I am shutting down the blog. As mentioned in the 'Happy New Year!', the blog will have refocus. From Malaysian centric to geographic/mapping centric. Once Again, engage with my blog more often, you guys need to know the power of MAPPING!

Thursday, 9 January 2014

Revitalizing Malaysian Geography Syllabus


When one mentions about Geography, people instantly think about capability of memorizing world capitals or naming top mountains. This is very much misguided view of Geography and more so, Geography is a neglected topic in the broader educational issue in Malaysia. There is a lot of controversies going with the History syllabus and concern of declining standards in English, Maths and Science. However, Geography as a subject is being overlooked.

 Looking at the current situation, our Geography subject is only thought as compulsory subject for lower secondary schools and thereafter, it becomes an elective for remaining school years. This means Geography teachers have 3 decisive years to ensure students to be Geo-literate before Form 4. First issue in Malaysian geography syllabus is the lack of definition and importance of the subject. In History and Science subjects, the text books clearly indicate what defines these subjects and why they are important for the world. In Geography text book, both of them do not exist at all. By not placing them, students would be wondering about the significance of the subject. Geography is basically the study of interactions between nature and human beings. It isn't about memorizing but it is about how the world works, world interconnections and implications of interactions and interconnections. New text books must highlight the role of Geography for society.

 Second issue is MOE previously favoured Science subjects to Arts (60:40) for schools. Since Geography is treated as an art subject, it gets neglected pretty much in many Malaysian schools. The problem becomes more obvious in upper secondary as Form 4 Geography syllabus covers topics of natural disaster and basics of geology. Malaysians must be educated through Geography on how natural disasters happen (as Science subjects do not cover them) so they can be prepared in future (i.e. tsunamis). New core Geography syllabus must cover some basics of natural disasters (especially climate change).

 Third issue is Geography syllabus do not highlight much about potential careers in this field. When the importance of the subject is not being highlighted and lack of knowledge of geographical careers, no one see the value of Geography. One view as a subject just to get 'A' and then forget about it. Today's world have witnessed the unprecedented usage of maps (No.1 geographical tool) in humanity's history. Malaysia, as it continually evolves, need people who are educated in Geography and Mapping Science. Everything from business to medicine to community work has a location aspect. Geography syllabus must highlight careers in growing field. Teachers should contact Geographers/Map-makers to visit schools to introduce exciting careers.

 Fourth issue is Geography syllabus and teachers must integrate new technologies to teach the subject. This must include new mapping technologies (i.e. Google Earth, web maps) to bring excitement in learning. After all, Geography is all about exploring the world we live in. Visualizing Geography through story telling or organize outdoor visits allows the students to appreciate the world around them. Moreover, introduction of mapping technologies will spark interest in students to consider a career in Geography.

 Fifth issue is Geography syllabus should challenge the general perceptions of the developing and developed world. The core Geography syllabus tend to highlight problems existing in developing world (i.e. overpopulation) and less so for developed world. As the world changes rapidly, geography syllabus must highlight alternative advances made in developing world (i.e. sustainable agriculture) and focus less on developed world. Malaysian worldview is skewed knowing a lot of Western World & Asia but very limited for other parts. This could be rectifying by presenting balanced view on issues in developing world.

 In Summary, Geography syllabus in Malaysia needs a refocus to be more relevant and useful. Though Malaysians would better rate understanding the world than Americans, five issues must be addressed to revive a subject of significance importance. Geo-literate Malaysians would be capable understanding their environment, make wise decisions and knowing the implications of actions they do in the world we live in.