 |
| Sample Section of STAR Interactive Election Map of Malaysia 2013 |
 |
| Sample Section of ABC Interactive Election Map of Australia 2013 |
However, this post would not be focusing on the obvious application of mapping in elections. We'll be examining Mapping in Election Strategy and Mapping in Addressing Election Issues
Mapping in Election Strategy
 |
| Australian Labor Party using Maps to 'scare' the voters on geographical basis if opposition takes control |
The above map illustrate a simple, yet powerful mapping technique employed by election strategist to capture attention of potential voters. It hardly require much geographical data (but need more attribute data) to identify the geographical distribution of Liberal National Party Cuts. Through this approach, voters will know up and close of the cuts and how it will impact them directly (refer below). This in turn influence the voters mind (but for this election, GIS didn't give much needed boost for dying Labor Party)
 |
| Examining Liberals's Planned Cuts and Labor's Planned Policies for Melbourne (3000) |
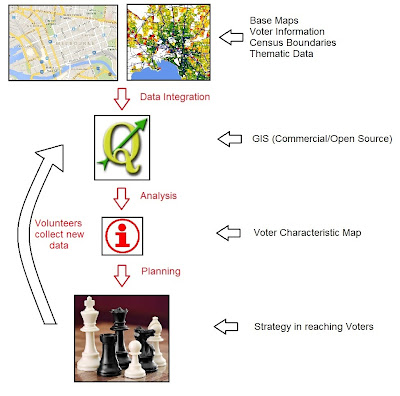
From this tool, we can conclude GIS or mapping in general is quietly being used by election strategists. Since most of world's data has a geographical component, in terms of elections, this would mean understanding geographical distribution of voters and their characteristics. Here are some data would be used by election strategists:
The above diagram shows the summary of application of GIS in election strategy. In terms of planning, GIS is wonderful resource where to distribute energy, time, money and volunteers to hit the voters. Using the map, politicians know where the target audience are. On top of that, when volunteers hit the streets, with the GPS on mobile devices, campaign managers can track the progress and see what other areas to progress further. If time is on the side of politicians, campaign strategists can use GIS to do predictions and use these data for coming elections.
In Summary, I have discussed two areas where GIS is used for election strategy. One is used to create scare campaign of the opponents and another on how to reach to the voters. Most of us just do not know whether this spatial technology gets applied in elections. The second part of the discussion would be on mapping/GIS and Addressing Election Issues.
- A base map (let say a Google map or traditional GIS map)
- Census boundaries for the area
- Voter characteristic (e.g. gender, income, age)
- Political or economic maps (if needed)
 |
| How GIS might be used for election strategy |
In Summary, I have discussed two areas where GIS is used for election strategy. One is used to create scare campaign of the opponents and another on how to reach to the voters. Most of us just do not know whether this spatial technology gets applied in elections. The second part of the discussion would be on mapping/GIS and Addressing Election Issues.
Sources
- http://www.powershow.com/view1/20c5b1MzVjM/GIS_AS_A_TOOL_IN_ELECTION_CAMPAIGNING_powerpoint_ppt_presentation
- http://www.enterpriseefficiency.com/author.asp?section_id=1195&doc_id=238931
- http://chartingtransport.files.wordpress.com/2012/09/2011-density-greater-melbourne1.png (Melbourne Map Image)
- http://geographyeducationdotorg.files.wordpress.com/2012/03/qgis_02.jpg (QGIS Logo)
- http://upload.wikimedia.org/wikipedia/commons/6/6f/ChessSet.jpg (Chess Image)
- http://www.hopsten.de/assets/images/iNFO_LOGO.jpg (Information Logo)
No comments:
Post a Comment